Retail teams often have two separate streams of information: traffic data shows how many people visit a store, while point-of-sale (POS) data records sales activity. Viewed separately, each tells part of the story. Connecting them lets operators examine customer traffic alongside transactions and sales results, creating a more complete view of store performance.
- Start With Consistent Data Definitions
Before connecting systems, decide what each dataset represents. Footfall may include walk-in counts, walk-out counts, or passersby, while POS data can contain transaction counts, sales amounts, and other store-level measures. Definitions should remain consistent across locations and reporting periods.
Time is equally important. A traffic record and a sales record need compatible timestamps or reporting intervals. When one system reports hourly data and another uses a different period, comparisons become harder to interpret. Establish common time ranges before building dashboards or recurring reports.
- Match Each Entrance With the Right Store Data
The physical structure of a store affects how traffic data should be connected with sales information. A location with several entrances may use multiple counters, while POS data may be consolidated at store level.
During setup, map each counting point to the correct store, department, or reporting unit. Also confirm how customer movement should be handled when people enter and leave through different doors. This mapping establishes a dependable relationship between traffic records and the corresponding sales data.
- Use Footfall to Add Context to Sales
Sales figures can change for several reasons, including shifts in customer traffic. A store may see visitor growth while transaction activity changes at a different rate. Looking at both datasets can indicate whether a performance change is associated with traffic volume or with activity later in the customer journey.
This is where footfall analytics adds context beyond a basic visitor count. Reviewing the same periods across traffic and transaction data shows how walk-in rates, conversion performance, and campaign results move together, and where the two datasets diverge.
- Connect Through an API or Supported Integration
The technical connection should match the retailer’s existing infrastructure. Application programming interface (API) integration can allow systems to exchange selected data without requiring employees to transfer figures manually.
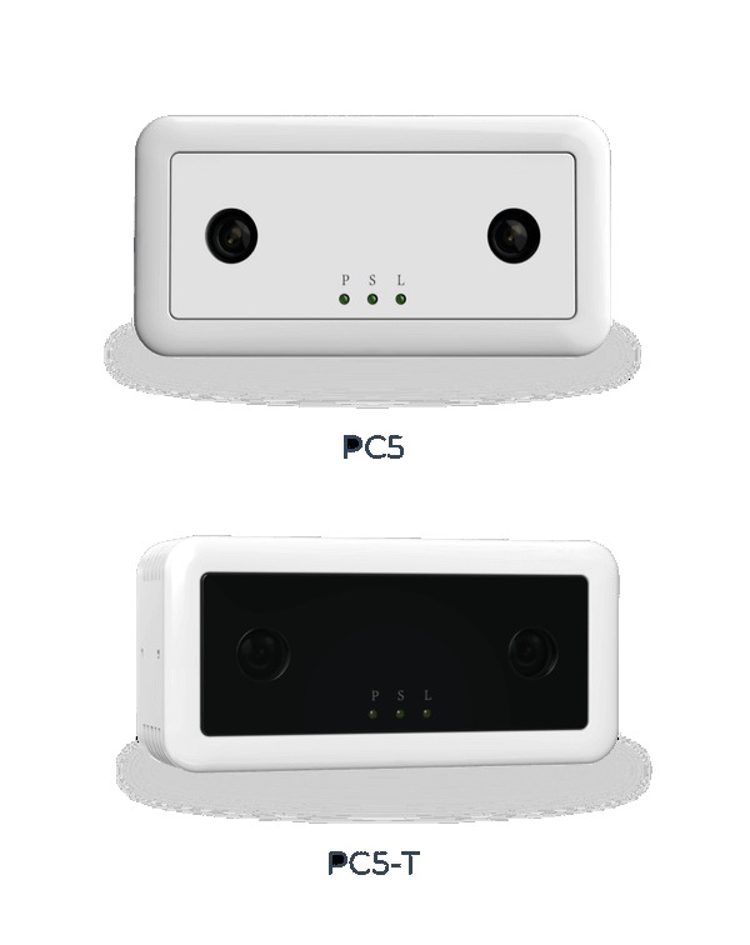
OVOPARK offers a standard API for seamless integration with existing POS systems. The analytics platform supports integration with mainstream hardware—subject to compatibility verification with your current equipment and model specifications. This makes it well-suited for retailers augmenting legacy sales infrastructure.
- Check the Reporting Layer, Not Just the Connection
A successful data connection does not automatically produce useful reports. After integration, compare the values shown in the reporting interface with the original source systems. Check whether dates, locations, totals, and reporting periods are displayed consistently.
The platform delivers traffic analysis across hourly, daily, weekly, monthly, and yearly timeframes. Store KPIs include walk-in rate, conversion rate, and multi-location ranking. Retail teams can choose reporting features matching their operational needs—and apply them consistently across stores.
- Build Reports Around Retail Questions
Retail analytics software becomes more useful when reports are tied to specific operational questions. Instead of creating dashboards filled with unrelated metrics, define the decisions the report needs to support.
For example, a regional team may need to assess traffic and transaction changes around a promotion, examine differences between locations, or identify stores that require further investigation. Structuring reports around these questions makes the information easier to interpret and gives different teams a shared reporting framework.
- Validate the Numbers Before Scaling
Run a controlled comparison before rolling the setup across a large store network. Select several representative locations and compare manual observations, people counting records, and POS reports over matching periods. Investigate discrepancies rather than averaging them away.
Check common causes such as different time zones, reporting cutoffs, multiple entrances, system downtime, or mismatched store identifiers. Document the agreed calculation logic and reporting rules so each location follows the same process.
- Make the Dashboard Useful for Ongoing Operations
Once the data is connected and validated, the focus can shift from technical setup to regular use. Regional teams can use the agreed metrics and reporting periods during routine reviews, while store teams can investigate unusual changes with the underlying data.
It’s also helpful to set a consistent reporting cadence: daily monitoring reveals sudden changes, while weekly or monthly reviews provide broader context for store planning. Using uniform definitions and time ranges across reviews simplifies historical comparisons and reduces confusion during team handovers.
For businesses evaluating retail analytics software, the key question is how clearly connected data supports traffic analysis, sales review, and store operations. The dashboard should clearly indicate each metric’s source, time period, and whether it’s measured, calculated, or imported.
From Data Connection to Action
Reliable retail reporting depends on more than placing footfall and POS numbers on the same screen. Clear definitions, consistent time periods, correct store mapping, verified integrations, and practical reporting rules all influence the quality of the final analysis.
For retailers using the OVOPARK platform, connecting people counting data with POS information creates a foundation for examining customer flow alongside store performance. A careful integration and validation process can make those combined datasets more consistent and useful for day-to-day retail decisions.
